Phenotypic variation
A proso millet diversity panel, consisting of 200 lines, was used in this study. These lines originated in 30 countries and represent all five races of proso millet (60.5% miliaceum, 12.5% compactum, 12.0% contractum, 8.5% patentissimum, and 6.5% ovatum). The phenotypic variability of this diversity panel (200 accessions) for agronomic and grain nutrient traits has been described in detail in our previous study26. In brief, the phenotypic evaluation indicated a significant genotypic variance and genotype × year variance for all traits except for basal tiller number, indicating the significant influence of genotype and environment and their interaction on the expression of traits. All but two traits showed high broad-sense heritability (> 0.60) in both years and when combined across years. The exceptions were basal tiller number and grain Fe content, which showed moderate heritability of 0.30–0.6026. In this study, 160 out of 200 accessions were included after filtering for high-quality SNPs. The frequency distribution of key agronomic and grain nutrient traits is presented in Fig. 1, and a complete list of traits investigated is presented in Supplementary Fig. 1.
Frequency distribution of key agronomic and grain nutrient traits of proso millet evaluated in 2015 and 2016 at ICRISAT Patancheru, India.
Genome-wide SNP variation
SNP diversity and population structure
For the final dataset, after filtering, we retained 160 accessions with 5621 SNPs. The SNP counts varied from 204 on chromosome 10 to 476 on chromosome 3 (Table 1). The SNP distribution across the 18 chromosomes is shown in Fig. 2. Analysis of the position and distribution of each SNP locus at the whole-genome level showed that 68% of the SNPs were within 100 kbp of adjacent SNPs. Further, using SnpEff27, each SNP locus was annotated based on its genomic location to predict coding effects. It was found that 4.5% of the SNP loci were in the exon regions and 15.6% in intergenic regions, while 43.7% and 36.18% of SNPs were in the downstream and upstream regions of the gene, respectively.
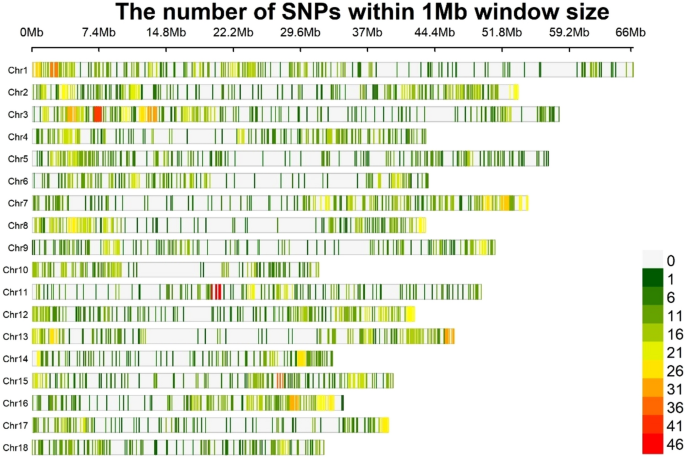
Chromosome-wise SNPs distribution, based on proso millet germplasm characterized using genotyping-by-sequencing (GBS) approach.
AMOVA (analysis of molecular variance)
The AMOVA indicated the highest contribution of variation within a race (71%) and within the region (66.9%). However, a low but significant contribution was observed between races and regions (4% and 8.4%, respectively) (Table 2). This implies that traditional race classifications based on morphology are weakly correlated with the underlying population genetics.
Genetic distance
The average Modified Roger’s Distance (MRD) of the entire set was 0.268 and ranged from 0.126 to 0.341. Among the races, accessions belonging to the miliaceum race had the highest average distance (0.274), whereas the lowest distance was observed among accessions within the ovatum race (0.201) (Supplementary Table 1). Figure 3 shows the minimum, maximum and median MRD of the entire set within and between the races. Among races, the lowest distance was observed between ovatum and contractum (0.248), followed by ovatum and compactum (0.250), whereas race patentissimum showed a higher distance from other races (0.260–0.272) (Supplementary Table 1).
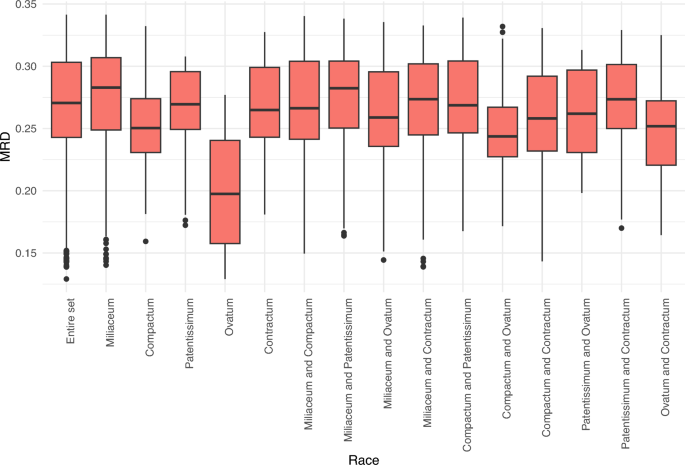
Modified Roger’s distance of accessions within and among races of proso millet based on GBS-based SNP characterization of proso millet germplasm.
Population structure
Principal component analysis and ADMIXTURE were used to infer the population structure of the collection, and clear subpopulation structures were observed (Fig. 4a). The first two principal components explained 28% of the total genetic variation and aided in visually differentiating the substructures within Asian accessions. PCA also showed the presence of a substructure within the collection, based on the regions and countries within the regions. A grouping of a small clump of 14 Asian accessions in the top center of the PCA biplot showed that these accessions were diverse from the other Asian accessions; on further observation, 12 of these 14 accessions were of Korean origin, while the remaining two accessions were from China and Germany. In addition, from the biplot, it can be seen that a diverse set of 20 Asian accessions clustered at the bottom-right. Further observation of the countries of sample collection found that most of the accessions were of Indian origin (14 accessions from India) and one accession from Sri Lanka, while other accessions were from Mexico, Syria, and other countries.
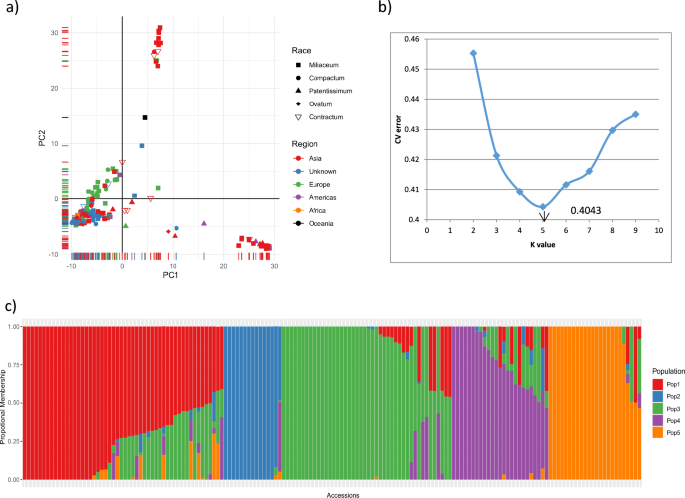
Population structure assessment of proso millet collection: (a) PCA biplot of 160 accessions based on SNPs from GBS, (b) rate of change in cross-validation (CV) error between successive k-values (k values ranging from 1 to 10), and (c) model-based population structure in proso millet collection based on ADMIXTURE with K = 5 populations for the 160 accessions.
The hierarchical population structure, using the model-based ADMIXTURE program, was run assuming K = 1 to 10 populations without providing any prior information on population structure. The obtained CV values and the corresponding ΔCV, combined with a line graph using CV errors for each K, showed that the CV error decreased steadily up to K = 5 and increased afterwards. This suggested the presence of five natural subpopulations (K = 5) (Fig. 4b) within our proso millet collection, and a K value of 5 was considered an appropriate population structure. The five populations were named POP1–POP5 (Fig. 4c). The accessions that had population membership of < 0.6 in all five populations were considered admixtures (accessions with genomes of two or more populations).
We assigned individuals to any of the five subpopulations considering the maximum proportion of membership. Accordingly, POP1, POP2, POP3, and POP5 represent most accessions from Asia, whereas POP4 represents most accessions from Europe (18 out of 25 accessions, including two unknown origins, one from America, and four from Asia). Accessions from Korea were grouped as POP2. Accessions of the race miliaceum dominated in all the populations, while the majority of accessions belonging to compactum were in the POP1, ovatum in the POP3, patentissimum in the POP 5, contractum in the POP 1 and POP 3. These distributions show that the proso millet accessions were not structured as per racial groups, while they were structured according to regions and countries within regions (for example, Korea in POP 2, Russia in POP 4), as observed in PCA. Overall, 93 of the 160 accessions had a population membership of > 0.90, while 31 accessions had a population membership of < 0.60. Approximately 17% of accessions (12 accessions) from Asia were admixture (< 0.60), while 37% of accessions from Europe had admixtures with different populations.
Hierarchical clustering based on the calculated MRD showed the presence of five major clusters (Fig. 5). The cluster dendrogram results also agreed with the admixture-based population structure in terms of both the number of populations and the presence of population structure based on regions. Cluster-5 was dominated by Korean accessions and cluster-4 was dominated by Indian accessions. Combining the cluster dendrogram and ADMIXTURE-based population membership, individuals belonging to clusters 1, 4, and 5 had well-defined allelic or membership proportions with fewer admixtures.
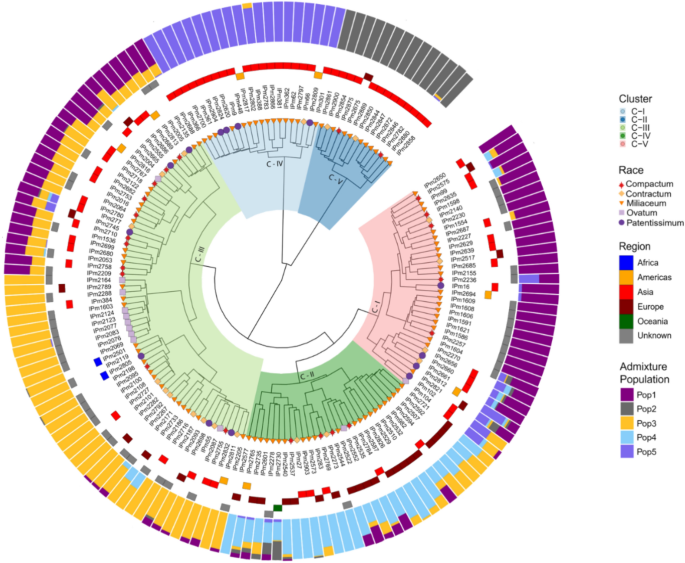
Cluster dendrogram of GBS-based SNPs, based on Modified Roger’s Distances (innermost colors on the dendrogram represent clusters, shapes at the nodes of the dendrogram represent races, tiles surrounding the dendrogram represent the region, and colored outermost bars represent the ADMIXTURE proportions-based population structure.
Linkage disequlibrium (LD) decay
The whole-genome average maximum r2 value was 0.52 at 5 kpb, which dropped to half that between 50 kbp (0.37) and 75 kbp (0.18), and plateaued after ~ 200 kbp (0.10 at 225 kbp to 0.05 at 30 Mbp) (Fig. 6).
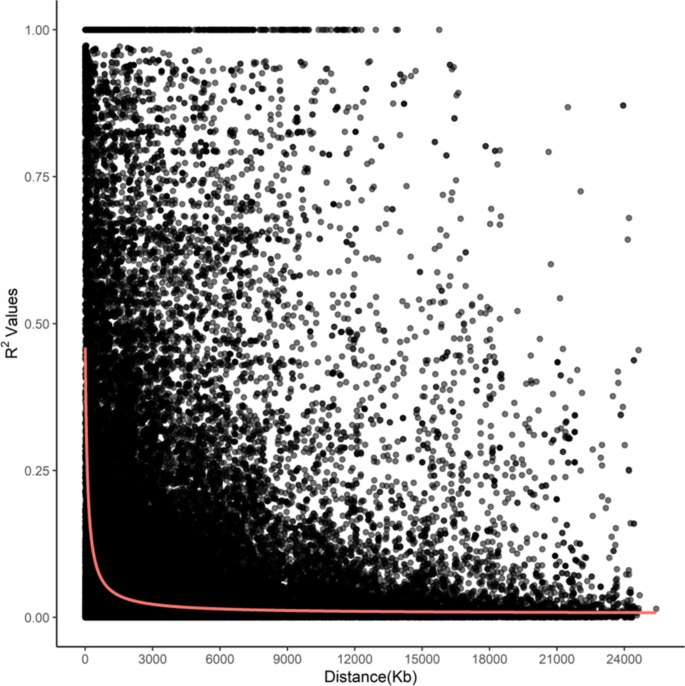
Genome-wide linkage disequilibrium (LD) decay in proso millet using GBS-based SNPs. Black dots represent individual SNP pairs on the same chromosome, while the red line shows the mean value.
Genome-wide association study (GWAS) on agronomic and nutrient traits
GWAS for agronomic traits identified 121, 95, and 95 marker-trait associations (MTAs) for 2015, 2016, and combined datasets, respectively, using FarmCPU with a p-value cutoff of ≤ 0.0001. Furthermore, when we looked for common MTAs across the three datasets (2015, 2016, and combined), 34 SNPs were found to be significantly associated with agronomic traits in at least two of them. Among these 34 MTAs, four SNPs for inflorescence length (Proso.1_8346815, Proso.14_27820106, Proso.12_34047515, and Proso.12_41890075) (Fig. 7) and one for plant height (Proso.7_1535098) were detected significant across all three datasets. Eighteen of the 34 MTAs were located in genes (Table 3). GWAS on grain nutrient traits identified 24, 37, and 26 MTAs for the 2015, 2016 and combined datasets, but only six were found in at least two of the datasets. Of these, two SNPs (Proso.17_30948407 and Proso.17_5885921, associated with Zn and Fe, respectively) on chromosome 17 were located in genes PM17G09880 and TE311547.
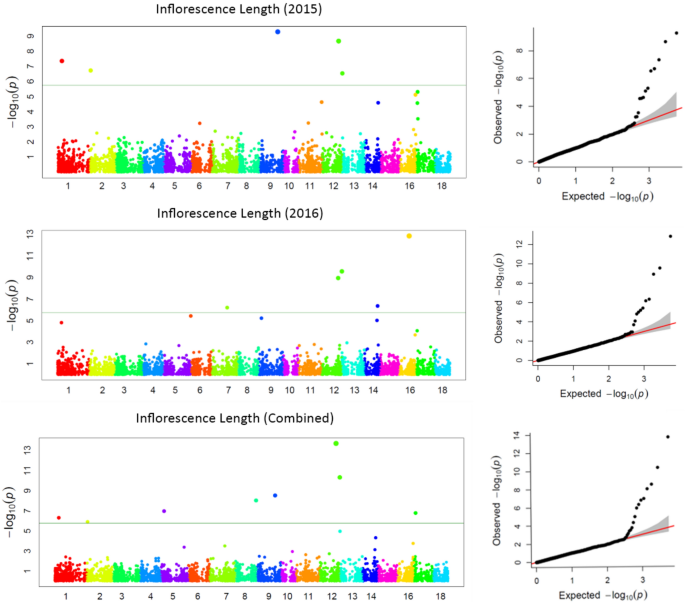
Manhattan plots and quantile–quantile (QQ) plots for inflorescence length (INFL) of proso millet evaluated in 2015 and combined for both years. The chromosomes are marked with different colors along the horizontal axis.
Comparative genomics
Twenty MTAs that were significantly associated with various traits were located within the genes. Although these specific SNPs are probably not causal polymorphisms for these traits, the rapid LD decay in this population (Fig. 6) implies that the genes have a strong probability of being involved. The sequence information of these genes was retrieved from www.genomeevolution.com and compared with related species to check the similarity and gene function. More than 90% similarity was considered to report the genes and their functions in related species (Supplementary Table 2). For example, the SNP Proso.2_14901071 associated with basal tiller number is located on the gene PM02G15460, showing over 90% similarity with genes in the three species, Panicum hallii, Panicum virgatum, and Setaria italica, with gene functions of “putative leucine-rich repeat-containing protein, sporulation-specific protein 15-like, and girdin-like”. The SNP Proso.17_3253916 associated with inflorescene length is located on the gene PM17G03120 showed over 90% similarity with genes in the closely related species namely Panicum hallii, Panicum virgatum, Sateria italica, with gene function of “filament-like plant protein”. The SNP Proso.14_27820106, which is associated with inflorescene length, is located in the gene PM14G15020 and showed over 90% similarity with Panicum hallii, Panicum virgatum, Sateria viridis, Setaria italica, and Zea mays genes with the gene function of “dihydrolipoyllysine-residue acetyltransferase component 4 of the pyruvate dehydrogenase complex, chloroplastic-like” (Supplementary Table 2).

